This post was published in 2024-02-14. Obviously, expired content is less useful to users if it has already pasted its expiration date.
Table of Contents
问题描述
在回顾这篇笔记:🔗 [(2023年8月)紧急回顾:条件概率/贝叶斯/MLE/MAP - Truxton's blog] https://truxton2blog.com/2023-08-relearn-likelihood-bayesian-mle-map/ 的时候,我总觉得下面这张图”左右两边的0/100尾巴“不对,它和理想的正态分布不太一样(两端的尾巴有明显的翘起)。
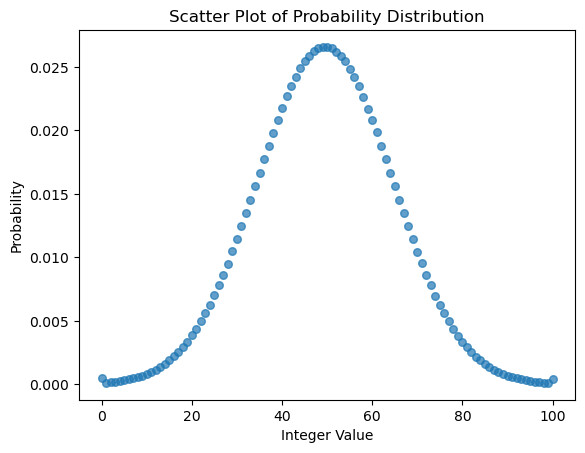
上面这张图的逻辑大概是:
- 生成100000000个遵循正态分布([mathjax]\mu=50, \sigma=15[/mathjax])的浮点数,大多数样本应该在0~100之间
- 把这些浮点数变成整数
- 去掉那些小于0和大于100的整数
- 对剩下的,位于[0, 100]的整数进行统计(由于都是自然数,所以可以使用bincount),然后生成[0, 1]的prior normal distribution
- 最后生成的prob_arr有以下性质:sum(prob_arr)=1, len(prob_arr)=101, prob_arr[0]代表prior=0的概率, prob_arr[1]代表prior=0.01的概率, prob_arr[2]代表prior=0.02的概率...prob_arr[100]代表1对应的prior.
所以上面这个环节肯定有哪里出了问题,导致最后留下来的0比1多。
由于原始代码是chatgpt给我的,我开始怀疑是代码有问题
问题1:np.clip()
问题1:np.clip()
原始代码有一段 clipped_values = np.clip(integer_values, 0, 100) ,这一段代码有很大问题
np.clip并不会使得那些不满足范围条件的数字去掉,而是会把它们近似成范围边界的数字:
import numpy as np
a = np.array([-1, 0, 1, 2, 3, 4, 5, 6, 7, 8, 9, 10, 11])
a = np.clip(a, 0, 10)
print(a)

# [ 0  0  1  2  3  4  5  6  7  8  9 10 10]
所以后面我把clip()删掉,然后改成了这种写法:
import numpy as np
a = np.array([-1, 0, 1, 2, 3, 4, 5, 6, 7, 8, 9, 10, 11])
a = a[(a >= 0) & (a <= 10)]
print(a)

# [ 0  1  2  3  4  5  6  7  8  9 10]
问题2: np.astype(int)
去掉np.clip解决了大部分问题,但还是不对:我发现正态分布的头部(0)仍然有一点点点点瑕疵,它们看起来仍然要比1高一点点。
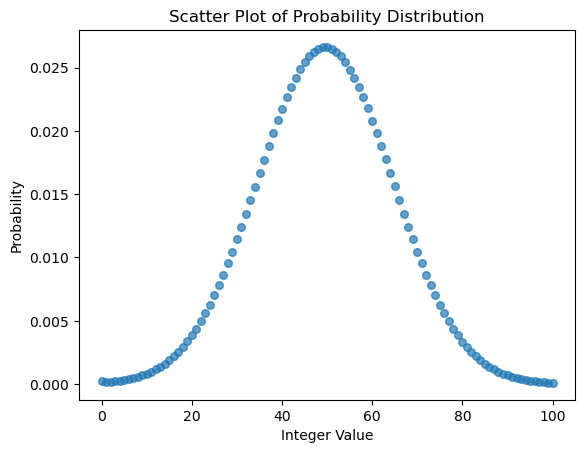
通过打印变量确定了这个问题确实存在。
看看下面这段代码:
import numpy as np

mean = 50
std_deviation = 15
num_values = 10000000

raw_integer_values = np.random.normal(mean, std_deviation, num_values).astype(int)

unique, counts = np.unique(raw_integer_values, return_counts=True)

print(dict(zip(unique, counts)))
结果为:
{-34: 1, -30: 1, -24: 1, -23: 1, -22: 1, -21: 1, -20: 3, -19: 6, -18: 5, -17: 15, -16: 15, -15: 15, -14: 26, -13: 30, -12: 50, -11: 59, -10: 69, -9: 103, -8: 137, -7: 162, -6: 208, -5: 263, -4: 364, -3: 462, -2: 599, -1: 752, 0: 2066, 1: 1486, 2: 1796, 3: 2101, 4: 2704, 5: 3202, 6: 4134, 7: 4866, 8: 5694, 9: 7037, 10: 8246, 11: 10067, 12: 11729, 13: 13684, 14: 16288, 15: 18679, 16: 22286, 17: 25040, 18: 29671, 19: 33789, 20: 38354, 21: 43811, 22: 49540, 23: 55943, 24: 62734, 25: 70396, 26: 78216, 27: 86317, 28: 95361, 29: 104349, 30: 114327, 31: 124443, 32: 134586, 33: 144907, 34: 155736, 35: 166364, 36: 177197, 37: 188311, 38: 197778, 39: 208738, 40: 217329, 41: 225784, 42: 235564, 43: 242631, 44: 248082, 45: 254631, 46: 258489, 47: 261806, 48: 264467, 49: 265870, 50: 265471, 51: 264267, 52: 262409, 53: 259041, 54: 254285, 55: 248846, 56: 241722, 57: 234886, 58: 226206, 59: 218280, 60: 208170, 61: 197885, 62: 187971, 63: 177415, 64: 166258, 65: 155884, 66: 145735, 67: 134047, 68: 124437, 69: 114306, 70: 104722, 71: 95521, 72: 86555, 73: 77917, 74: 70232, 75: 62751, 76: 55871, 77: 49196, 78: 43538, 79: 38393, 80: 33777, 81: 29400, 82: 25368, 83: 21937, 84: 18975, 85: 16301, 86: 13830, 87: 11778, 88: 9714, 89: 8339, 90: 6900, 91: 5865, 92: 4840, 93: 3891, 94: 3289, 95: 2607, 96: 2192, 97: 1890, 98: 1414, 99: 1177, 100: 945, 101: 717, 102: 619, 103: 468, 104: 353, 105: 260, 106: 226, 107: 173, 108: 132, 109: 97, 110: 74, 111: 63, 112: 50, 113: 42, 114: 25, 115: 18, 116: 17, 117: 10, 118: 9, 119: 6, 120: 4, 121: 3, 122: 4, 123: 2, 125: 3, 126: 2, 128: 1, 129: 1}-1: 752个
0: 2066个
1: 1486个
2: 1796个
可以看到,0的数量就是要比1的数量(甚至2的数量)要多。
原因发生在numpy astype(int)身上:
注意:python的int()也有类似问题,今天是我第一次注意到我对int()理解一直有偏差
最开始我以为astype(int)或者python int()是一个类似floor逻辑的代码:
import math


print(math.floor(-0.1)) # -1
print(math.floor(-0.9)) # -1
print(math.floor(0.9)) # 0
print(math.floor(1.1)) # 1
print(math.floor(1.9)) # 1
但后来发现并不是:
import math

print(int(-0.1)) # 0
print(int(-0.9)) # 0
print(int(0.1)) # 0
print(int(0.9)) # 0
print(int(1.1)) # 1
print(int(1.9)) # 1.9
原来int()并不是floor也不是ceil也不是round,而是 去掉小数点 ,所以它会把-0.1变成-0,会把-0.9变成-0
这也是上面那段正态分布抽样代码的问题:很多随机到-0.x的数字和随机到0.x的数字都变成了0,导致最后统计出的0的个数特别多。
所以给上面的代码补充np.rint().astype(int),结果就对了(np.rint就是做round操作):
import numpy as np

mean = 50
std_deviation = 15
num_values = 10000000

raw_integer_values = np.rint(np.random.normal(mean, std_deviation, num_values)).astype(int)

unique, counts = np.unique(raw_integer_values, return_counts=True)

print(dict(zip(unique, counts)))
结果为:
{-31: 1, -29: 1, -27: 2, -25: 1, -22: 3, -21: 4, -20: 6, -19: 6, -18: 10, -17: 12, -16: 11, -15: 27, -14: 32, -13: 31, -12: 49, -11: 61, -10: 82, -9: 114, -8: 169, -7: 189, -6: 219, -5: 322, -4: 372, -3: 514, -2: 702, -1: 799, 0: 1040, 1: 1349, 2: 1614, 3: 1959, 4: 2442, 5: 3002, 6: 3675, 7: 4347, 8: 5257, 9: 6300, 10: 7535, 11: 9075, 12: 10858, 13: 12744, 14: 14825, 15: 17478, 16: 20355, 17: 23679, 18: 27285, 19: 31497, 20: 35985, 21: 41358, 22: 46795, 23: 52591, 24: 58958, 25: 66509, 26: 73892, 27: 81779, 28: 90960, 29: 99438, 30: 109826, 31: 119451, 32: 129550, 33: 139679, 34: 150134, 35: 161718, 36: 171534, 37: 182713, 38: 193030, 39: 203076, 40: 213414, 41: 221346, 42: 230413, 43: 238580, 44: 246309, 45: 251635, 46: 257212, 47: 261382, 48: 264224, 49: 265210, 50: 265018, 51: 265608, 52: 264077, 53: 259837, 54: 257109, 55: 251544, 56: 245746, 57: 238833, 58: 230648, 59: 222136, 60: 212626, 61: 202393, 62: 192796, 63: 181752, 64: 172190, 65: 161689, 66: 151031, 67: 139884, 68: 129279, 69: 118953, 70: 109696, 71: 99424, 72: 91167, 73: 81885, 74: 74040, 75: 66115, 76: 58947, 77: 52800, 78: 46728, 79: 41138, 80: 35852, 81: 31653, 82: 27539, 83: 23446, 84: 20296, 85: 17395, 86: 14886, 87: 12629, 88: 10793, 89: 9067, 90: 7576, 91: 6413, 92: 5312, 93: 4441, 94: 3662, 95: 2985, 96: 2525, 97: 2073, 98: 1588, 99: 1292, 100: 1002, 101: 785, 102: 647, 103: 488, 104: 427, 105: 325, 106: 244, 107: 173, 108: 138, 109: 118, 110: 83, 111: 66, 112: 59, 113: 46, 114: 38, 115: 24, 116: 16, 117: 11, 118: 6, 119: 12, 120: 4, 121: 6, 122: 5, 123: 3, 124: 3, 125: 2, 126: 1}-1: 799个
0: 1040个
1: 1349个
2: 1614个
修改结果
现在看起来就顺眼多了:
import numpy as np
import matplotlib.pyplot as plt

mean = 50
std_deviation = 15
num_values = 100000000

raw_integer_values = np.rint(np.random.normal(mean, std_deviation, num_values)).astype(int)

filtered_integer_values = raw_integer_values[(raw_integer_values >= 0) & (raw_integer_values <= 100)]

# Count the occurrences of each integer value
counter = np.bincount(filtered_integer_values, minlength=101)

# Normalize the counter array to get probabilities
probabilities = counter / np.sum(counter)

# Generate x values for the scatter plot (integer values)
x_values = np.arange(0, 101)

# Create a scatter plot
plt.figure()
plt.scatter(x_values, probabilities, marker='o', s=30, alpha=0.7)
plt.xlabel("Integer Value")
plt.ylabel("Probability")
plt.title("Scatter Plot of Probability Distribution")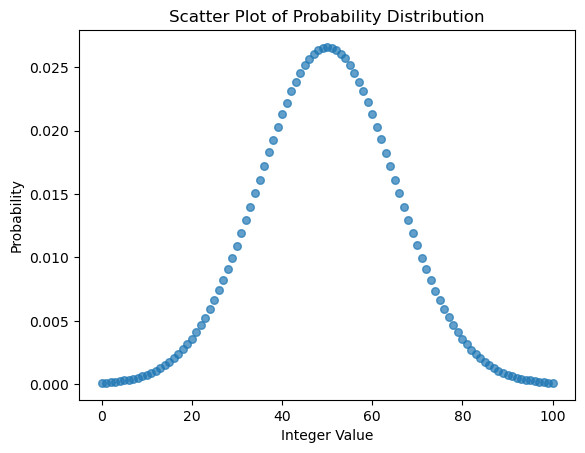
有关np.bincount
太长时间没看这段代码了,所以讨论一下上面代码里的np.bincount(),原始代码保持不变(还是用bincount):

np.bincount()并不是什么范围的数值都能统计的,事实上它只能统计自然数的计数,而且某些结果并不是非常符合直觉:
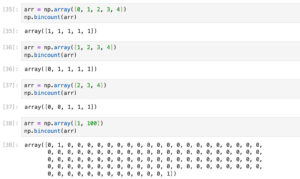
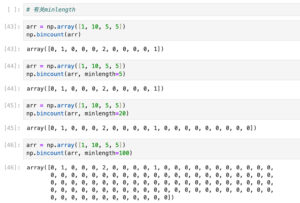
所以本篇笔记的prior生成代码里, counter = np.bincount(filtered_integer_values, minlength=101) 的minlength=101是有用的:
minlength改成<101的数值(比如100):逻辑上不合理,如果filtered_integer_values的最大值小于100,那么bincount()就会漏掉max(filtered_integer_values)后面的统计;但实际代码里因为生成了100000000个数,filtered_integer_values的最大值肯定是有100的,所以不影响.
minlength改成>101的数值(比如1000):bincount()会返回一个1000长度的数组,其中只有前101个是有用的,后面都是0(因为要统计到999).
如果不想用np.bincount()可以用其他的,比如自己手动统计count,比如用python Counter,但实测下来python Counter速度慢很多,估计是中途引进了一个用不着的排序:
import numpy as np
import matplotlib.pyplot as plt

mean = 50
std_deviation = 15
num_values = 100000000

raw_integer_values = np.rint(np.random.normal(mean, std_deviation, num_values)).astype(int)

filtered_integer_values = raw_integer_values[(raw_integer_values >= 0) & (raw_integer_values <= 100)]

from collections import Counter

counts = Counter(filtered_integer_values)
counter = np.array([counts.get(i, 0) for i in range(101)])
probabilities = counter / np.sum(counter)
print(np.sum(probabilities))
x_values = np.arange(0, 101)

# Create a scatter plot
plt.figure()
plt.scatter(x_values, probabilities, marker='o', s=30, alpha=0.7)
plt.xlabel("Integer Value")
plt.ylabel("Probability")
plt.title("Scatter Plot of Probability Distribution")
plt.show()